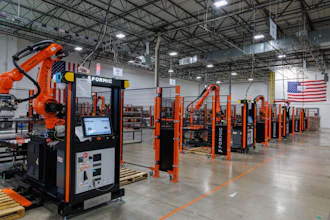
One statistic recently shocked me: output per worker in U.S. manufacturing has been almost flat since 2007. In a world where the U.S. wants to re-shore and rebuild its industrial base, this is concerning for competitiveness and, ultimately, for the sustainability of the whole industry.
Indeed, if you invest heavily in manufacturing but still can’t provide products at a competitive enough offering, customers will turn to cheaper solutions and the whole investment will struggle to pay back.

Full source here: https://www.bls.gov/opub/mlr/2026/article/is-manufacturing-productivity-recovering-evidence-from-the-past-and-present.htm
At the same time, U.S. manufacturing does not need to compete purely on price and can offer much more: innovation, speed, quality, easier logistics and more predictable prices versus tariffs and currency fluctuations. However, there is still a threshold where the price gap becomes too big and customers turn away.
At the same time, capital intensity in manufacturing has increased by 54 percent. In other words, the amount of capital supporting every labor hour in U.S. manufacturing has increased 54 percent since 2007.
So where does it come from? How can a 54 percent increase in capital intensity lead to almost no productivity gain?
To have the start of an answer, let’s look at another mind-blowing statistic: U.S. manufacturing dedicates roughly half the share of investment to digital assets compared with manufacturing in other OECD countries.

As you know, complex topics have complex causes, and correlation does not mean causality. However, I can’t help but connect those two facts. My theory is that a significant portion of that productivity gap comes from a lack of digital investment and digital maturity in the mid-market.
Indeed, what drags down productivity on the office floor? Inefficient processes, difficulty finding or producing documentation, difficulty finding or entering information, and a lot of coordination and human-to-human time required to bridge all those gaps.
In other words, we automated production, we did not automate coordination.
This is what I call the Coordination Tax. It can represent a huge avoidable cost when you start looking more closely at a company’s P&L. It is a silent line that is hard to measure because it sits between teams, hard to act on because it involves different process owners, and sometimes hard to accept because it often comes from the very people who decide and are supposed to optimize the manufacturing environment: the office floor.
The Coordination Tax usually comes with three main consequences.
Capacity Tax
People spend time searching, updating, reconciling, communicating and following up. It’s common to see people literally walking 300 feet to a colleague to ask for information that could have been available in two or three clicks.
It’s also common to see a kind of symbiotic relationship between company growth and meeting growth. The more the company grows, the more coordination it needs. The more coordination it needs, the more meetings it creates. Often, the time people spend in meetings being inactive is time they don’t spend increasing output. It gives a strong impression of being busy, but it does not necessarily increase throughput.
Latency tax
The work sits between people and processes, which can easily multiply the necessary end-to-end delay by five.
This is a quote that takes two hours to generate but sits there for five days because the estimator is too busy. This is a router review that takes one hour but gets stuck for one week because the production manager is busy fixing issues on the shop floor, delaying the whole program start.
Each step looks small but stacked together the delay becomes huge.
Opportunity tax
Slow coordination means idle capacity, inventory, delayed launches and missed revenue.
One of the most difficult things in manufacturing is aligning demand and capacity. Usually, when you get a large backlog, you increase capacity, but the lag to do so often means that this capacity comes online after the cycle has already changed. This can lead to overcapacity. And when you are under capacity, you lose customers that find other solutions, which can make the next cycle even harder to manage.
In one mid-sized manufacturer where I was able to measure this in detail, the Coordination Tax represented close to 30 percent of office-floor capacity. The economic impact was equivalent to roughly 20 percent of EBITDA, before even accounting for delayed or lost revenue opportunities. We also estimated that capacity and coordination constraints were putting roughly 20 to 25 percent of potential revenue at risk.
The broader pattern is not based on a single company: over the past months, I’ve discussed these issues with around 60 manufacturing companies, and the same estimate around 30 percent busy work, 20-25 percent opportunity loss came consistently.
Why Don’t Leaders Act More Aggressively?
First, because it is hard to measure. KPIs are much more developed on the shop floor. On one side you have cycle time, rework, Cpk, First Pass Yield, machine uptime, yield per line, OEE and dozens of other KPIs. On the other side, you often have… not much. Sometimes you have better metrics in sales, such as conversion rate and quote lead time, but that is about it.
Second, because many leaders in the mid-market come from a strong manufacturing background. They are extremely good at seeing issues on the shop floor, but in a way this can make the systems and inefficiencies of knowledge workers less visible.
Third, because improving office-floor throughput usually requires software. And software has suffered from a systemic lack of investment in U.S. manufacturing: in top talent, in management attention and in money.
So what can we do about it? Digitize and automate the office floor, and take it as seriously as automating the shop floor.
The leading companies and digital native manufacturers already understand this. They automate what can be automated while keeping humans at the critical touch points: judgment, early or final validation, prioritization, incident response and major customer escalations.
They also understand that implementing digital systems can make people feel slower at first, especially shop-floor workers and experts who suddenly need to enter more data, use more systems and pay more attention to digital workflows versus simply doing their core work. But the ROI compounds over time as workflows become better and more automated.
And so what does AI change in this equation? I’ll cut through some of the current fog and buzz. I don’t believe AI is ready to independently run long-horizon processes or make major decisions, and even if it were technically ready, I don’t think most people or organizations would be ready to accept it yet.
But there is already a very large opportunity. AI is very good at automatic data entry, data reconciliation, connecting different sources of information, making sense of unstructured data, and preparing work for people.
More concretely, that can mean AI preparing a quote draft or helping the estimator; crossing CMM data with contracts or requirements to identify possible compliance issues; reading incredibly long measurement files to prepare the work of quality controllers; identifying all pending actions on an NPI project and chasing status on the highest priorities; reading meeting minutes and updating the CRM accordingly; or checking shipment information and preparing ERP updates.
None of this sounds as spectacular as an autonomous factory, but it can free a very meaningful amount of scarce engineering and operations capacity.
If you told a CEO that you had a magic wand to recover 30 percent of overhead capacity, gain several points of EBITDA, and increase the amount of business the organization can handle without immediately adding headcount, I think most would say yes right away.
So the real question is: have you measured your Coordination Tax yet?