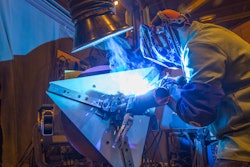
Many companies want to improve performance in their welding operation, but they may not have the right tools to measure improvement. A welding information management solution can measure and track performance metrics to improve productivity and quality — making an overall positive impact on the bottom line.
Accurate, real-time data collection and analysis can provide a benchmark for measuring the impact of improvements.
New technology can also help companies transform that data into dollars — providing a better understanding of the actual financial impact of the problems, and how changes and improvements can benefit the welding operation.
Measuring Productivity
Understanding how to effectively measure productivity is key to tracking improvement in the welding operation. It can be measured in several ways — from arc-on time to deposition rate and the number of parts out the door. Focusing on only one measure is not a recommended practice, as all three measures should be considered collectively to best understand the financial impact.
Assessing only deposition rates, for example, doesn’t provide a full picture because operators may be overwelding or putting down too much filler metal.
Consider how a welding information management system offers insight into the most common measures:
• Number of pieces or parts produced: Electronically measure the pieces or parts being produced per day or per shift — something that is much more difficult and cumbersome to track manually. This measurement lets the company know exactly what is being produced and helps set goals for improvements.
• Deposition rates: Companies can track and compare this data to see if deposition rates are varying day to day or week to week, to get a better idea on whether rates can be improved. Be aware that deposition rates can be a misleading indicator when used as the sole factor measuring productivity, as the rates can vary greatly depending on the type and diameter of filler metal used. Very thick wire or filler metal produces a much higher deposition rate compared to thin wire, for example.
• Arc-on time: Again, it is not recommended to use arc-on time as the sole variable to measure productivity in a welding operation. Combining arc-on time data with statistics that measure parts out the door is important to gain a more complete picture of productivity and areas for possible improvement, along with improved cost savings.
New technology available in welding information management systems provides the ability to more easily consider these factors together.
Using Data to Reveal Common Issues
Studying the data produced by a welding information management system can help bring light to many issues — and spur the right questions about productivity and profitability to help an organization make improvements.
Many factors can significantly impact the efficiency and financial wellness of a welding operation. These issues may be upstream, in the welding process or in post-weld cleaning. Making changes in these areas can help drive positive outcomes, by way of increased arc-on time and improved deposition and throughput.
If an organization finds that its arc-on time and deposition rates are low, there are numerous common causes to consider:
• Parts not arriving at the weld cell on time
• Incorrect parts delivered to the weld cell
• Poor part fit-up that creates excessive time spent clamping fixtures and filling gaps
• Clamping fixtures that need replacing
• Inefficient weld cell layout
• Wire feeding problems
• Gas flow problems leading to contact tip burnback
• Downtime for maintenance issues, including liner changeover
• Rework of poor welds due to porosity or other issues
• Excessive time spent on post-weld cleanup or grinding
Making positive changes to correct these types of problems can yield significant improvements in the efficiency and profitability of a welding operation. However, it’s important to have the right welding information management solution to help quantify those changes in a way that makes sense financially.
Turning Welding Data into Dollars
Turning welding data into actual dollar amounts helps tell a story for management and decision makers. With available welding information management systems, companies can gather data and monitor production in a welding operation — and translate that information into financial values.
Companies can compare two periods of time — hours, days, weeks, months or quarters. The tool calculates data by percentages, hours, pounds of wire used or shielding gas used per minute. At the same time, it calculates a dollar figure based on inputs that the user enters. These inputs include labor and material costs.
This graphable tool allows management to see the financial implications of productivity changes in the welding operation. Whether it’s arc-on time, deposition rate, parts produced or gas usage — users can assess that data financially, as well as a quantifiable figure to understand each time period for easy comparison.
Data that shows arc-on time at 6 percent and arc-off time at 94 percent may not be impactful depending on who is reading it. However, showing arc-on time that costs $1,000 in labor and arc-off time (time spent not welding or non-value-added time) that costs $24,000 in labor might be more impactful. This comparison helps companies be more aware of the financial implications of minimizing non-value-added activities, which often include grinding, part movement and fixturing, or replacement of consumables.
Based on the values that are entered into the system for the time periods being compared, a company can see what changes must be made — and what those increases would cost — to hit a specific goal, whether it be more arc-on time or more parts out the door.
The key driver of this type of technology is producing data regarding quantifiable financial improvement — metrics that are reflected in a report regarding total welding costs.
The Bottom Line
Collecting welding information is an important part of establishing and maintaining a productive welding operation — one that can have a significant impact on the bottom line.
There are tools available that make it easier for companies to compare productivity metrics and convert welding data into financial terms. This allows companies to see the financial implications of making specific changes or setting certain goals for the welding operation.
At the end of the day, it’s about having the right metrics to challenge the way it’s always been done, challenge assumptions and set goals — and ultimately decrease the cost of non-welding time and labor in the operation.
Ryan Lindeman is a product specialist for Insight Welding Intelligence Systems at Miller Electric Mfg. Co. For more information, visit www.millerwelds.com. This originally appeared in IEN's June, 2017 print edition. Click here to subscribe.


