When professional sports teams use big data and analytics, their objective is to improve player performance and win more games.
That approach is paying off in a major way.
For instance, after the Golden State Warriors became one of the first NBA teams to invest in analytics, the team subsequently won league championships in 2015, 2017 and 2018. Analytics is the science of looking for patterns in data to make more informed decisions. The Warriors also get regular assists from partners in Silicon Valley – the famed tech hub near where the team is based. For that reason, it’s a small wonder why, in 2016, the Warriors were recognized at a sports analytics conference as the “Best Analytics Organization.”
National Football League teams rely heavily on data as well. For instance, the Philadelphia Eagles used analytics for everything from in-game strategy to roster management as the team ultimately went on to win Super Bowl LII – its first Super Bowl victory in franchise history – in 2018.
With the sports market expected to reach US $83.1 billion in 2023, it’s a safe bet that big data and analytics will continue to play a big role in it.
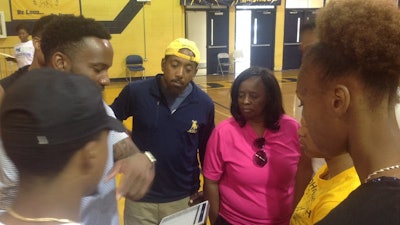
That’s why, as a computer science researcher and educator, when I use big data and analytics to help the men’s and women’s basketball teams at Johnson C. Smith University, where I teach, my objective is much broader than just figuring out how players can score more points and win more games.
Rather, using federal grant money that the Department of Defense has allocated for Historically Black Colleges and Universities – like mine – I have designed and expanded an entire research project that deals with the use of big data in sports.
My students are known as “DATA Bulls.” That name is a combination of the acronym for “Data, Analytics, Technology and Athletics,” and the nickname for our teams: the Golden Bulls. One of our chief aims is to use sports to boost the number of Black students in computer science education and research.
While we spend a lot of time using tracking devices and analyzing the data we get from those devices to help the Golden Bulls win games, the ultimate goal of the DATA Bulls project is to use sports data as an engaging way to help students learn computer science.
My students may not necessarily land coveted jobs as in-house data scientists for a professional sports team, although they will certainly be better positioned to do so. But even if they don’t, I believe the experience will better prepare them to get good-paying jobs in the computer science field.
Growth expected
Federal data show that computer and information research scientist jobs are expected to grow 15% by 2029 over what they were in 2019 – much faster than the average for all occupations. That means job prospects are expected to be excellent.
But colleges and universities are coming up short when it comes to preparing students to take these jobs.
For instance, the Business Higher Education Forum found in 2016 that while 69% of employers in 2021 would prefer job candidates with data science and analytics skills, only 23% of educators said at the time that all students graduate with these skills.
Despite numerous efforts to increase the participation of racial and ethnic minorities in computer science, students of color are still underrepresented in the field.
For instance, of the 71,420 bachelor’s degrees awarded in computer and information sciences in the 2016-2017 school year, just 6,391 – or 8.9% – went to Black graduates, and 7,233 – or 10.1% – went to Hispanic graduates – even though Black and Hispanics represent 14% and 19% of U.S. college students, respectively. Technically, white students are underrepresented in computer science as well, but still make up the majority. White students earned 39,492 – or 55.2% - of bachelor’s degrees in computer and information sciences in the 2016-2017 school year.
Asian students are the only overrepresented group, having earned 10,425 – or 14.5% – of the computer and information sciences degrees awarded that year. Asian Americans represent 5.6% of the U.S. population.
The problem is even more dire for women of color in computer science. For instance, Black and Hispanic women, separately, earned about 1 out of every 10 computer science and information bachelor’s degrees that went to women.
Broadening participation through university programs is just one way to narrow the gap. And by teaching the use of analytics in sports, it’s a way to get students to see computing as much more than just programming or fixing computers, as important as those tasks may be.
Sensors and shots
The premier sports analytics equipment used in my project involves work with ShotTracker, a sensor-based system that automatically captures real-time statistical and performance basketball analytics.
With ShotTracker, players place wearable sensors on their shoes. Sensors are also placed in basketballs and in the arena rafters to track the activity on the court below. Collectively, these sensors help provide data on over 70 different statistics, such as shots made, rebounds, turnovers and assists.
Coaches and players use this data to improve how the team performs throughout the season.
The data also enables my students to develop and explore questions. So far, students have used ShotTracker data to analyze things such as how individual players and the entire team performs per possession. They have also compared shooting percentages during practice versus actual games. We have analyzed shot attempts, makes and misses, and have discussed how this data could inform players shot choices.
We have also used Python – a widely used programming language for data analytics – along with our own datasets to create custom shot charts. The ShotTracker app creates a shot chart as well, which can be used for analysis after every practice.
 A shot chart graphic automatically developed within the ShotTracker Team App.Felesia Stukes, Author provided
A shot chart takes a half-court view of the floor, splits it into various zones, and tracks where players attempt, make or miss shots. With shooting data, players and teams can identify their strengths and improve shooting weakness from a variety of locations on the floor.
Beyond the court
The DATA Bulls project has implications that go beyond my campus.
For starters, it pairs sports tech companies and coaches, who – as far as I know – typically don’t work with computer science professors in this way. It’s also a way to enable athletic programs and teams with small budgets to use technology they may not otherwise be able to afford to improve their performance.
Perhaps most importantly, I believe it serves as a model for universities to expose more students to technologies that might otherwise be out of reach.
This article is republished from The Conversation under a Creative Commons license. Read the original article here: https://theconversation.com/for-these-students-using-data-in-sports-is-about-more-than-winning-games-148898.

